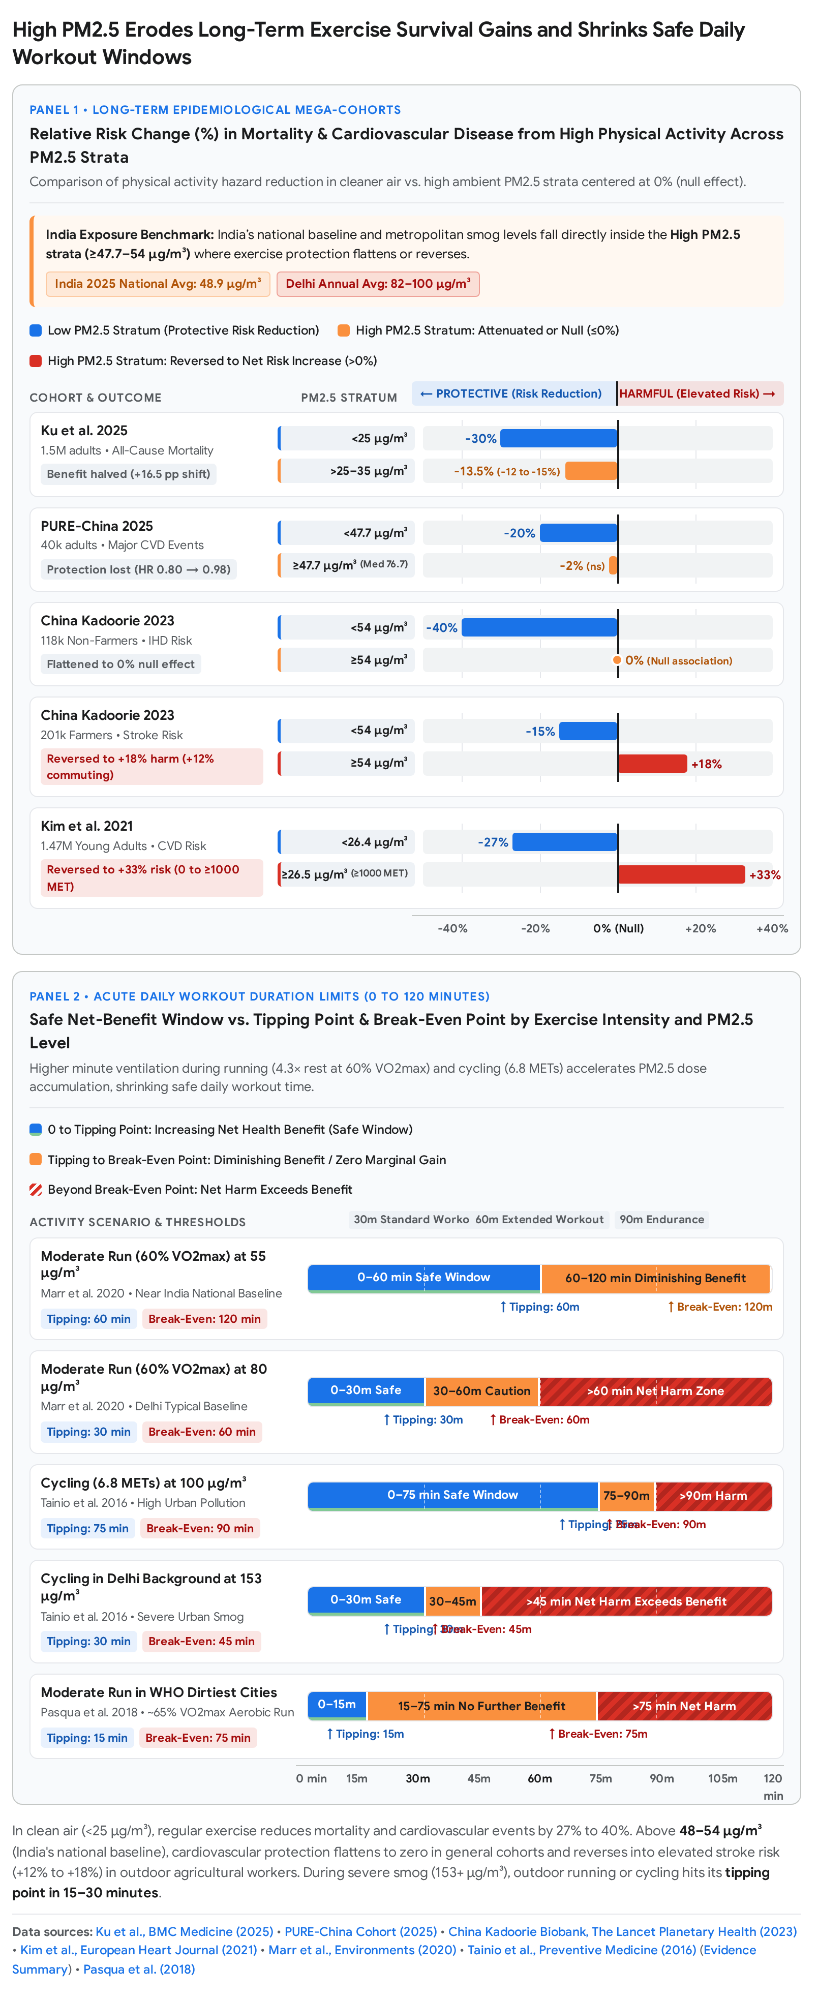
What the comparison bars mean Outdoor Planner compares PM2.5 and ozone exposure with fixed 30/60-minute brisk-walk benchmarks, across all AQI bands and six MET levels. Whichever pollutant reaches a benchmark first controls the clock. These are planning choices, not safe durations or benefit-cancellation points. Indoor retains the supplied formula. Activity cards show the green endpoint; Research explains both methods.
Current air & next-hour outlook The headline and Planner use AQI (India/CPCB): lower numbers mean better air quality on this index. PM2.5 is shown separately and is the input to the inhaled-mass calculation. AQI is never substituted for PM2.5.
“Similar AQI” means a difference of at most 5 points with no category change. Otherwise the next-hour outlook says lower or higher. Crossing an AQI category takes priority. This is an interface rule for small changes, not a health threshold. Missing next-hour AQI gives an unavailable outlook.
Live mode requests current conditions, history and forecasts from Google Maps for the selected Indian location. Google’s original timestamps and values are retained; only their display timezone changes to IST. Missing hours remain missing. Demo mode is separately labelled and editable.
India AQI severity scale The current marker is positioned proportionally on the 0–500 India/CPCB scale: Good 0–50, Satisfactory 51–100, Moderate 101–200, Poor 201–300, Very poor 301–400 and Severe 401–500. Category labels and thresholds follow the India AQI categories .
Find your air rhythm Drag the clock, or use its arrow keys, to choose an original Google clock time, displayed in IST, to see the India/CPCB AQI reading at that time on each of the previous seven completed calendar days. Dates and values are shown directly, without averages, medians, ranges or rankings. Missing readings show “No data”; they are not filled in. Weekly history loads separately from current conditions.
Planner The chart shows 24 hours from the available 36-hour forecast, starting with the next provider forecast hour. Times and dates use Google's original hourly timestamps in IST. Missing hours remain missing. Select a future hour to plan a workout. Its PM2.5 and ozone update the outdoor exposure benchmarks; the selected hour stays fixed throughout the clock preview. The separate inhaled-mass estimate follows available hourly PM throughout the selected duration.
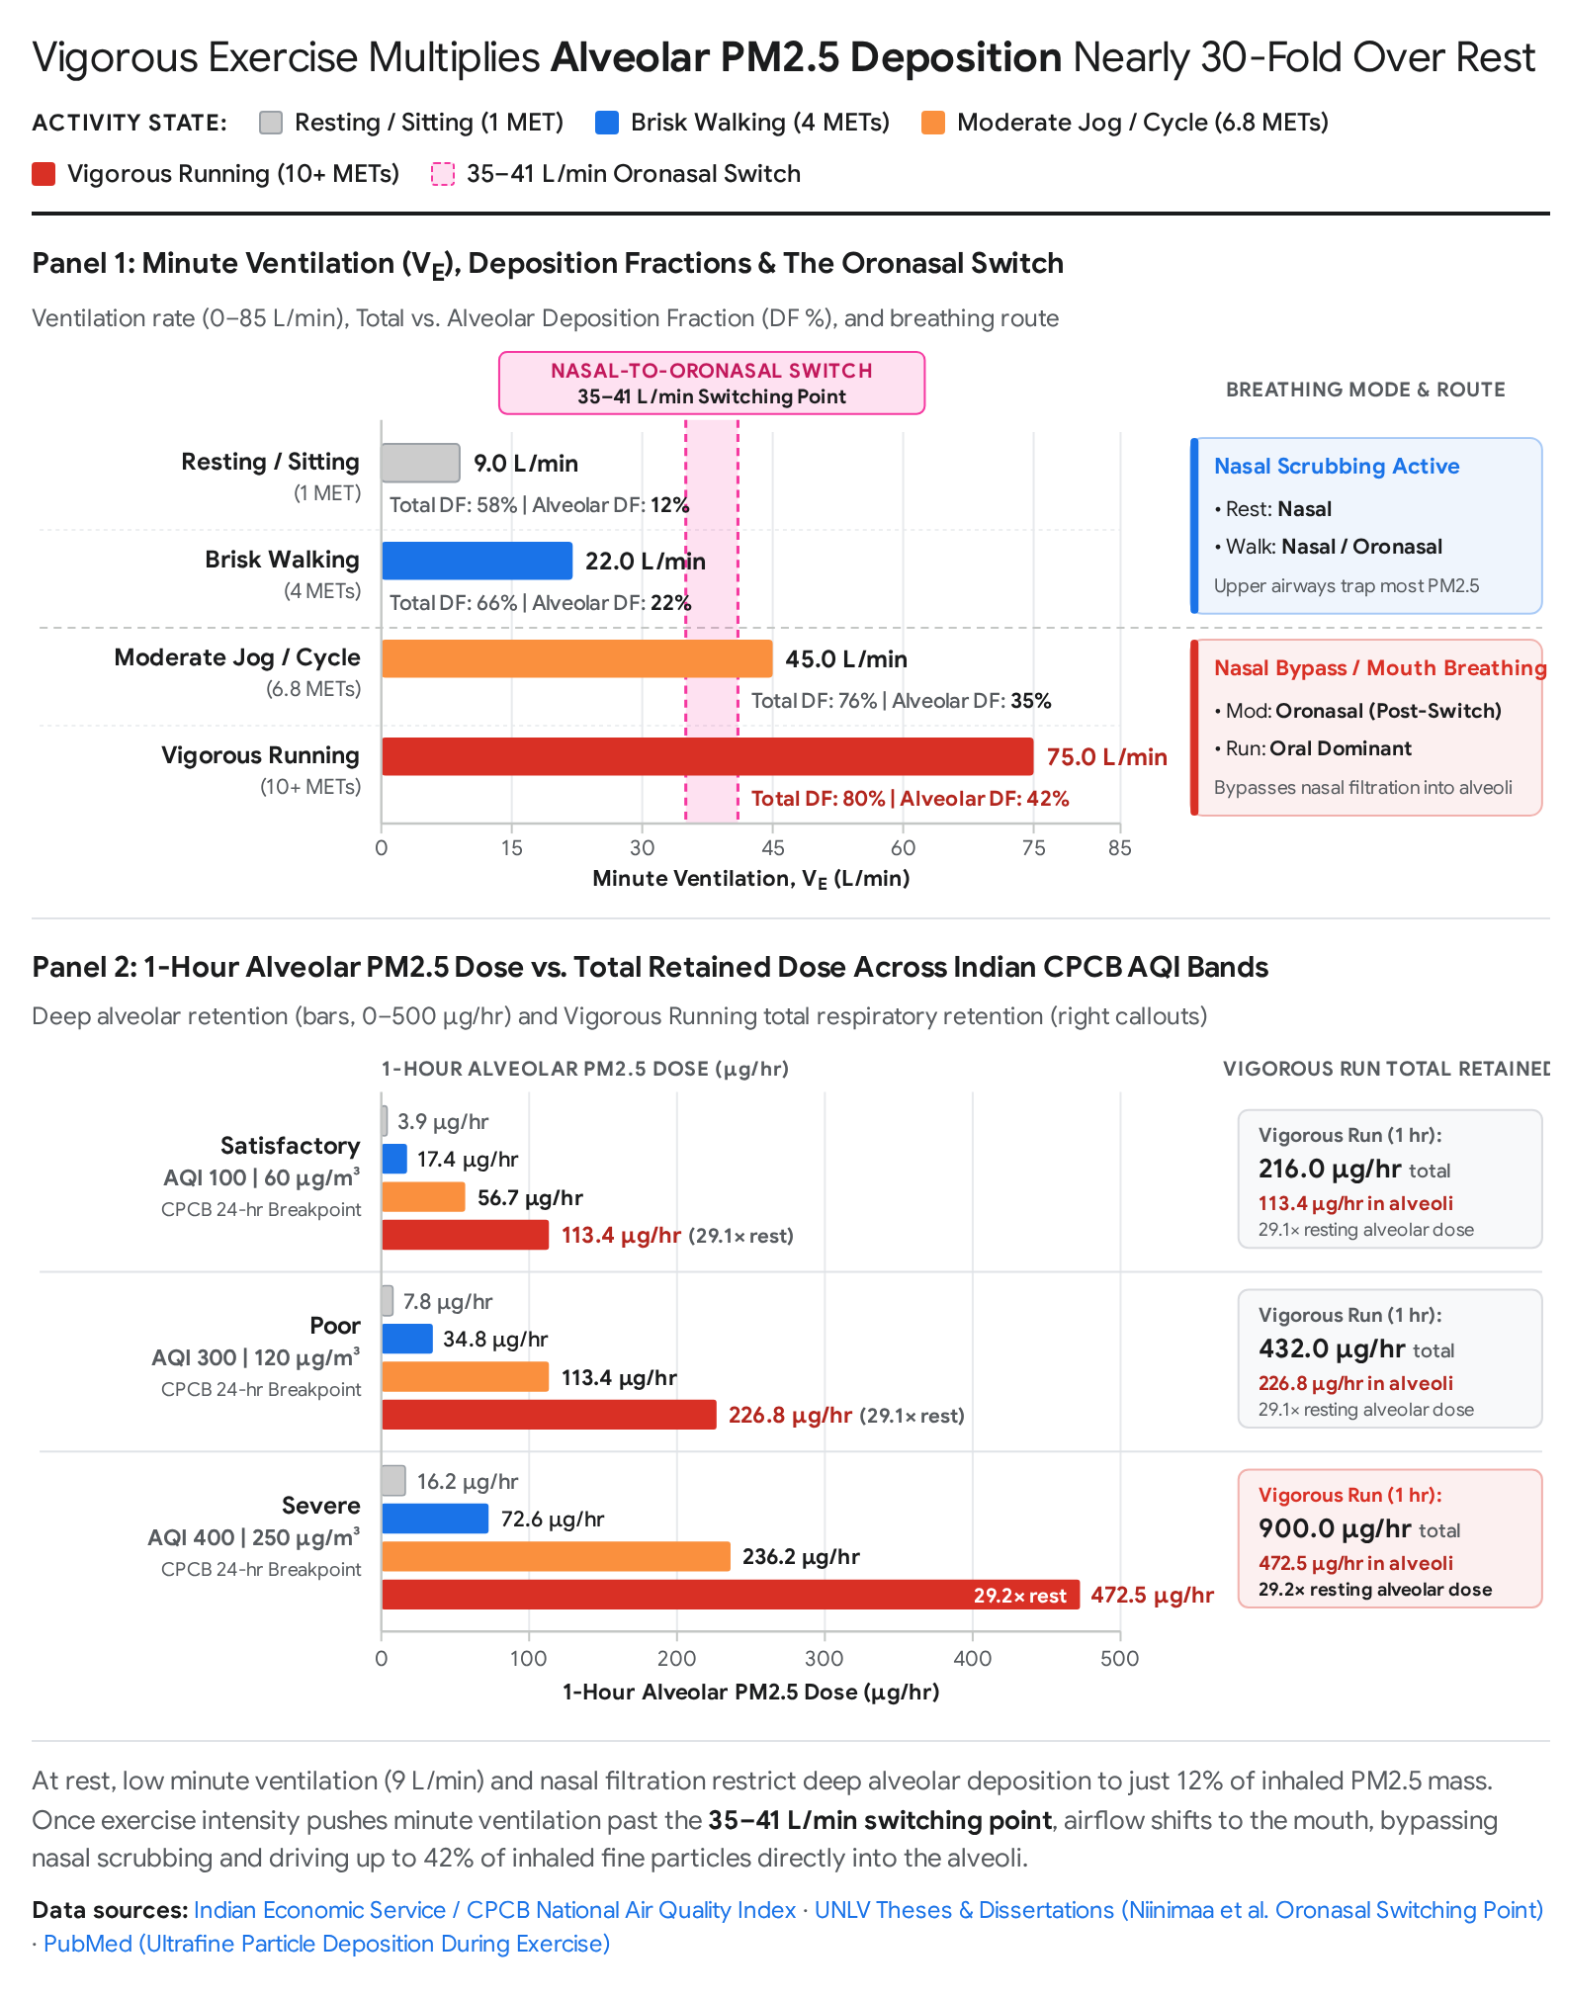
The EPA estimate VE = weight × exp(b₀ + b₂ ln(age) + b₃ sex) × (0.0035 × MET)b₁ , in litres per minute. Sex is coded −1 for male and +1 for female. Coefficients change by age band; residual error is set to zero.
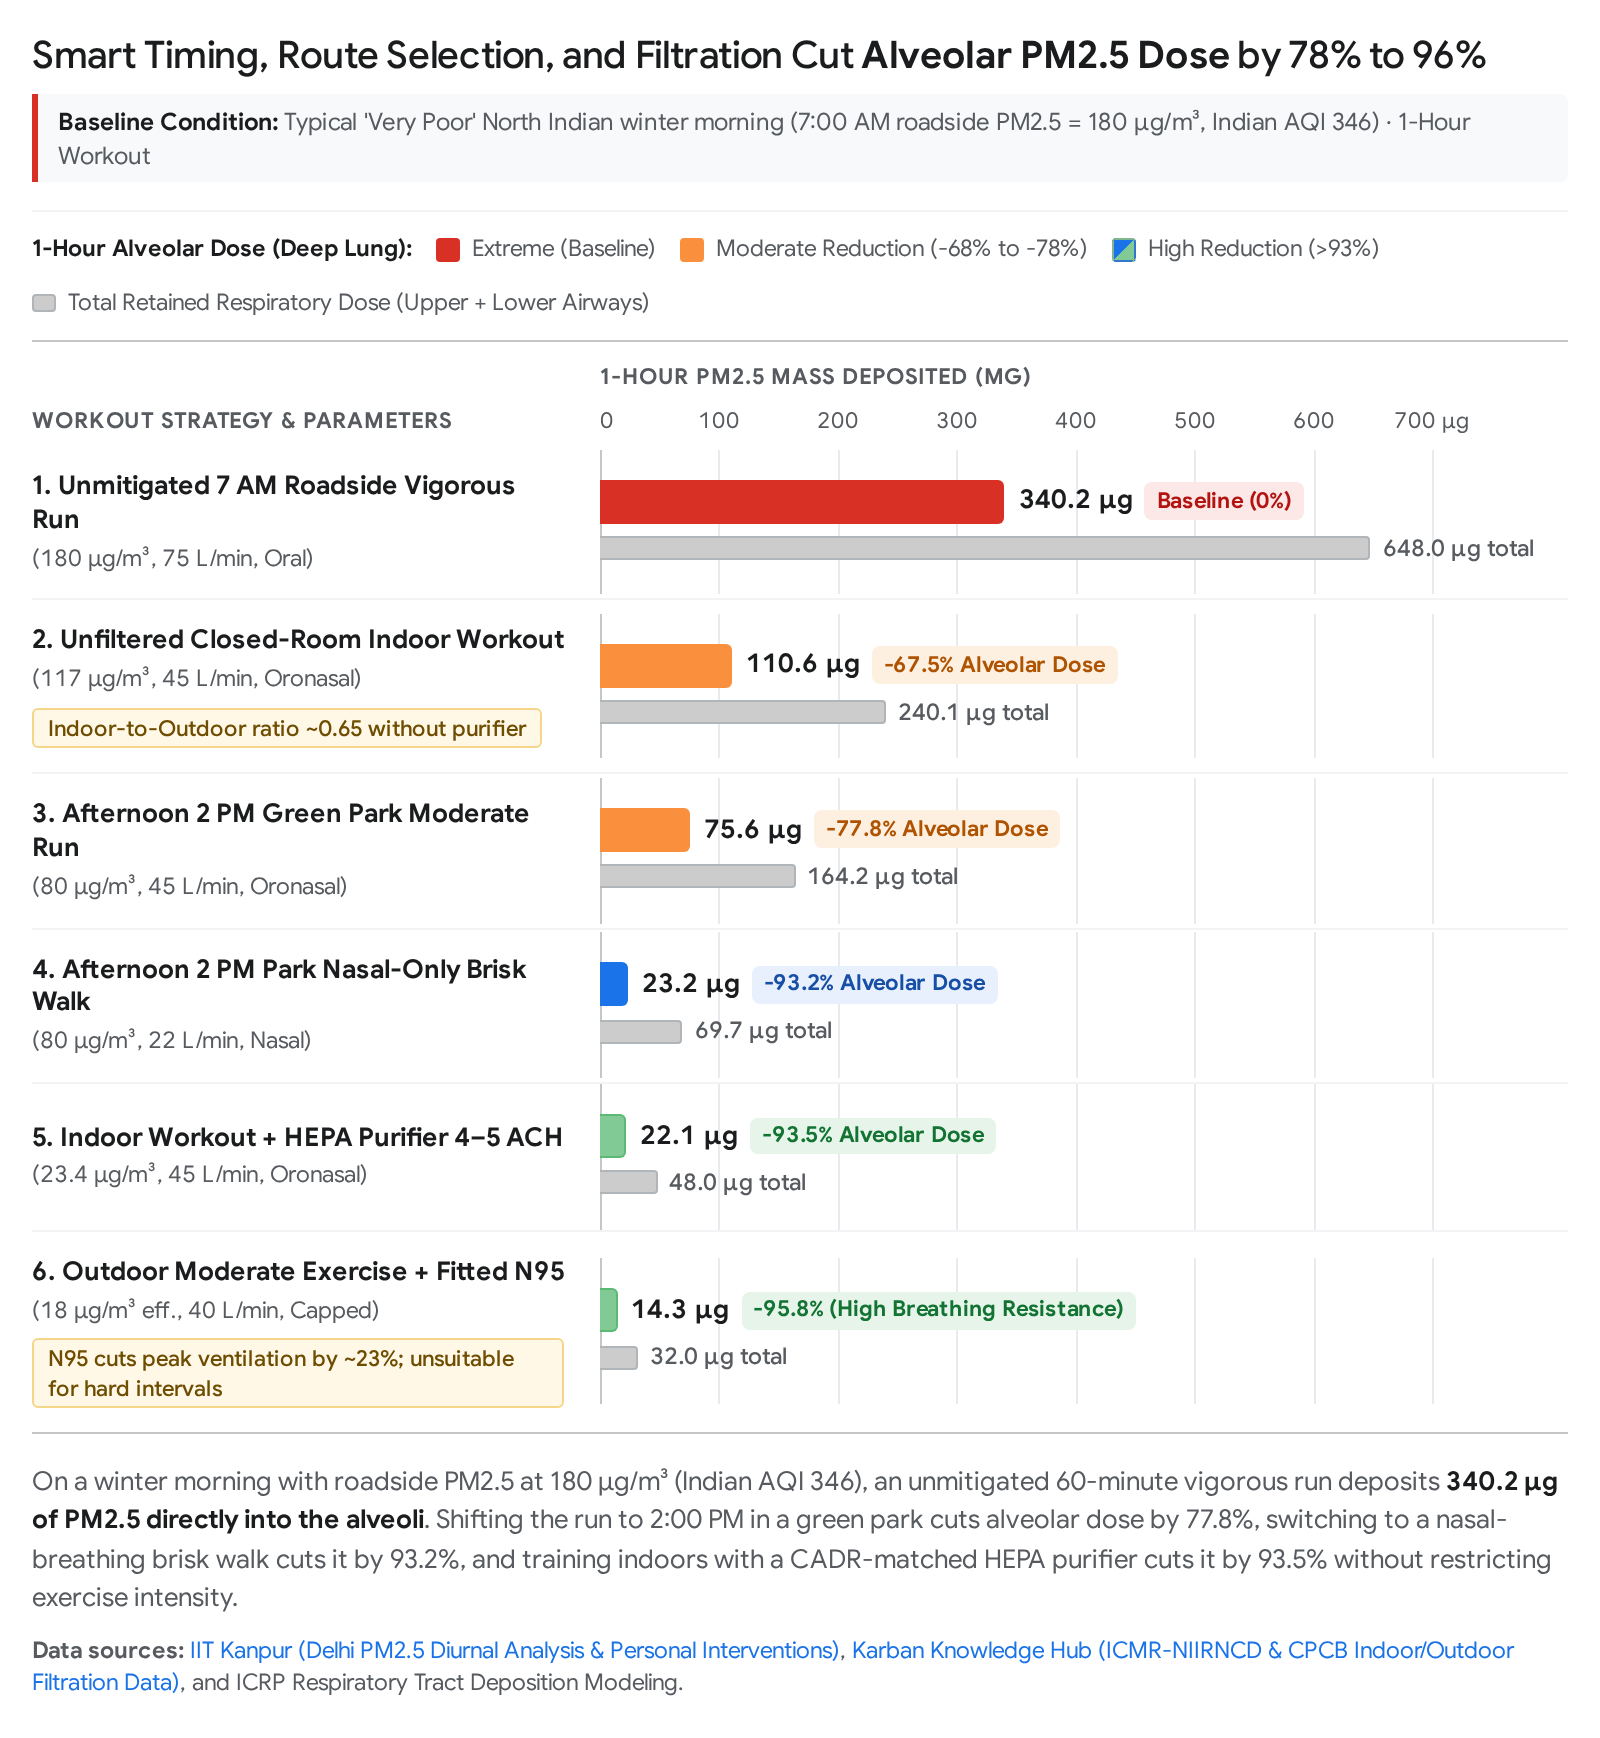
Dose (µg) = PM2.5 (µg/m³) × VE (L/min) × duration (min) ÷ 1000. Sessions integrate PM2.5 across each forecast hour while exercise MET stays constant.
This is a population-based central estimate, not a measurement or a model specifically validated for an Indian individual. Weight, age, sex and MET affect estimated inhaled mass.
Indoor supplied model The unchanged indoor equation uses a generic MET-to-ventilation and particle-deposition scenario. Its calibration is 7 MET, PM95 and a 30-minute tipping point. Profile values, disease multipliers and automatic purifier reductions are not inserted into that formula. Its source tables cover MET1–10 and PM30–350. Colour zones are model estimates, not personalised medical limits. Consult local AQI health advice independently of the clock.
Colours & assumptions Outdoor AQI categories use the India/CPCB index bands. The indoor meter remains a PM2.5 concentration display, not an indoor AQI. Its concentration cues use the US EPA breakpoints (9, 35.4, 55.4, 125.4, 225.4 µg/m³); an hourly concentration is not an official daily AQI or a NowCast. Lower PM or AQI does not mean safe exercise.
Outdoor green/yellow minutes follow the fixed exposure benchmarks; beyond the upper benchmark the ring is red. Indoor retains its supplied tipping/breaking calculation. These are not AQI colours or personal safety ratings. Adding to plan saves that preview. Marking it done manually credits the saved workout; there is no live tracking. An over-limit workout receives zero green minutes, yellow minutes and XP; this is a game rule, not a research result.
Indoor PM is your manual constant reading, initially an example. A purifier is not assigned an automatic reduction. In “assume last PM continues” mode, exposure estimates beyond forecast coverage carry an asterisk. “Require more forecast” leaves them unresolved.
Sources
Air quality insight Cerebras summarizes only the AQI readings already loaded in this app. Observed history and future forecasts are labelled separately; missing readings are not invented. AQI values and timestamps are sent through the server to Cerebras. Your coordinates, profile and workout history are not included. The generated summary does not change the clock or rewards.
Your data Profile, workout duration, selected city, favourites, plans and completed progress stay in this browser. The free v1 has no account or cloud sync. Live Google air-quality readings are kept in memory for this visit and are not written to browser storage. Device coordinates are sent to Google through the private server for the requested lookup. A Planner exercise spot is saved only when you select “Remember this spot on this device”; otherwise it lasts for this visit. The map is provided by OpenStreetMap, which receives requests for the area you view. The API key is stored only as a server secret.
Google air-quality data is subject to the Google Maps Platform Terms and Google Privacy Policy . This is a private prototype for comparing estimated exposure.
Clear saved settings Use demo data instead